The hidden cost of visual gaps on the digital shelf

Product imagery is often measured as a content output: how many assets were produced, delivered or published. But on the digital shelf, its impact is ultimately financial.
Baymard Institute found that 56% of users begin exploring product images as their first action on a product detail page (PDP). Its research also shows that insufficient resolution, scale or visual information can make products harder to evaluate and, in some cases, lead shoppers to abandon otherwise relevant products.
At scale, those visual gaps can affect conversion, retail media efficiency and ultimately the amount of revenue a PDP is capable of generating. The question is therefore no longer simply: “Do we have enough product images?” It is: “Do we have the right product visuals for this product, on this PDP, for this shopper?”
Product visuals have become part of the conversion infrastructure
Major ecommerce platforms already reflect this shift. Amazon recommends six product images, with additional images showing the product in use, from different angles and highlighting relevant features. Shopify similarly recommends combining multiple angles, close-ups and lifestyle imagery depending on the product.
The commercial impact is measurable. Profitero found that products meeting their category benchmark for image count generated a 36% sales uplift compared with those that did not. The takeaway isn't that every PDP needs more images. It is that visual completeness matters, and what “complete” means depends on the product.
1. Visual gaps can cost conversion
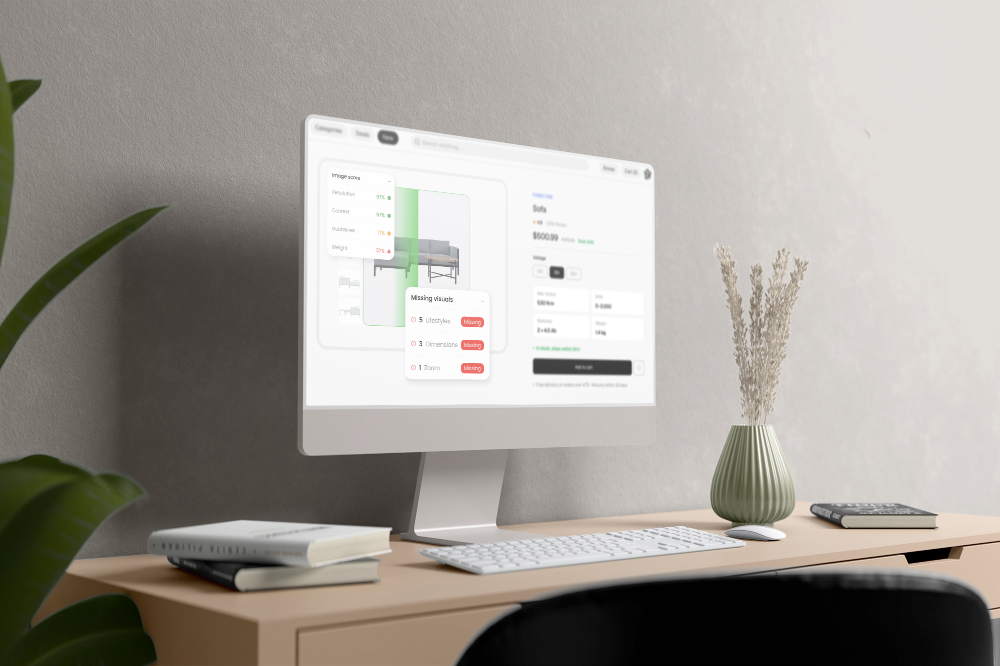
A PDP has to give shoppers enough visual information to evaluate a product confidently. When an important angle, dimension, feature, texture or accessory is missing, that evaluation becomes harder.
Baymard found that 42% of users attempt to determine product size through product images. Its research also found that 44% of sites fail to adequately show included accessories, even though this information can influence the purchase decision. The financial implication is straightforward: traffic has already reached the PDP, but incomplete visual information can prevent that demand from converting. A visual gap is therefore not simply a content issue. It can become a conversion issue.
2. Weak PDPs make paid traffic more expensive
The financial problem becomes even clearer when paid media enters the equation. Retailers and brands invest heavily to drive shoppers from retail media, paid search, social advertising and marketplace advertising to PDPs. But the value of that traffic ultimately depends on what happens after the click.
Profitero found that 44% of retail media campaigns drive shoppers to PDPs that fail to meet fundamental content benchmarks, including imagery, titles and bullets.
More importantly, optimized PDPs achieved 29% higher ROAS. Two campaigns can generate the same traffic at the same media cost, yet produce very different returns if one sends shoppers to stronger PDPs. Paid traffic can only perform as well as the destination it lands on.
3. Visual performance affects more than conversion
Visual performance can create a compounding effect across the digital shelf. Product visibility, conversion and media performance are interconnected. A PDP that converts poorly generates less value from the traffic it receives. Ecommerce teams may then compensate with additional media investment, while better-performing competitor pages continue converting that traffic more efficiently.
The result can become an expensive loop:
Incomplete visual coverage → lower shopper confidence → weaker conversion → lower media efficiency → greater dependence on paid traffic.
This is why product imagery should not be managed exclusively as a production KPI. The number of assets created says little about their commercial usefulness. What matters is whether the assets required for each PDP are actually present, relevant and visible once the product is live.
4. There is no universal “right number” of product images
One of the biggest mistakes in digital shelf strategy is applying a single visual benchmark across an entire catalog. Five images might be enough for one product and completely inadequate for another.
Amazon recommends six images as a general benchmark, for example, but the right visual mix ultimately depends on what shoppers need to evaluate. Shopify makes the same distinction: the most effective mix of white-background, lifestyle, detail, scale and other image types depends on the product and where it is sold.
A consumer buying a beauty product does not need the same information as someone buying a sofa, dress or power drill. The relevant KPI therefore isn't simply image count. It's visual coverage.
What visual coverage can look like by category
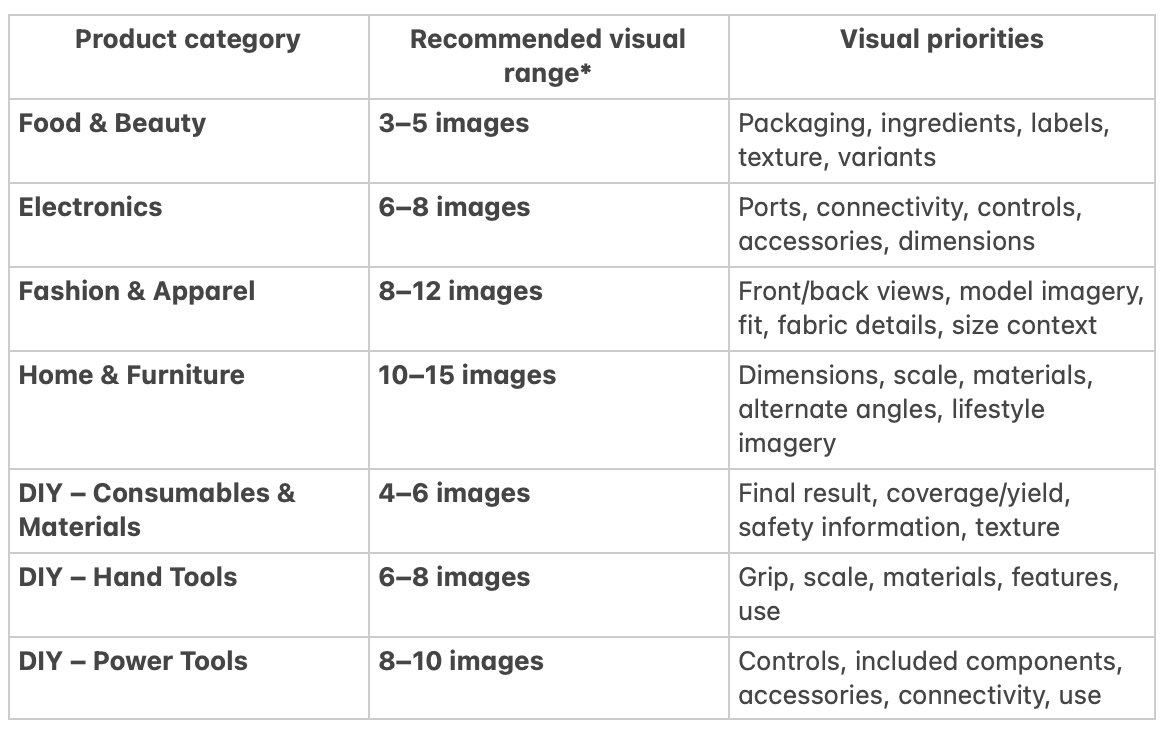
*Indicative ranges rather than universal requirements. Actual needs vary by product, retailer and marketplace.
This category-specific approach is supported by Baymard's UX research: different visual types solve different evaluation problems, from scale and proportion to compatibility, texture and contextual use. For example, scale is particularly important for Home & Living, while model imagery can provide essential context for fashion and accessories. Visual completeness is category-dependent.
5. The right images also need the right role
Image count alone doesn't tell you whether a gallery is effective. Each visual should add information that helps shoppers evaluate the product.
On Amazon, the main image shapes the first impression in search, while the rest of the gallery should add complementary information through alternate angles, contextual imagery and product features.
A strong visual mix typically covers: Hero → Alternate angles → Details / texture → Scale / dimensions → Lifestyle → Features / compatibility
The exact mix varies by product and category. What matters is that each image serves a distinct purpose rather than simply increasing the asset count. A PDP with eight repetitive images can therefore be less useful than one with six images that each answer a different shopper need.
6. More images aren't automatically better
At Nfinite, we typically see 5–8 distinct product images as a strong baseline for high-performing product listings, combining elements such as alternate angles, close-ups and lifestyle imagery. But it is a baseline, not a rule. If eight existing images communicate essentially the same information, adding another angle may create little value. A single missing dimension, feature or lifestyle visual may be far more useful.
So the optimization question moves from: “How many images do we have?”
to: “Which important visual is missing?”
7. Incomplete visuals also create expectation gaps
The financial impact doesn't necessarily end at conversion. Product visuals establish expectations before purchase. Dimensions, materials, finish, color, scale and included components all help shoppers understand what they will actually receive. When those signals are incomplete, the risk of a mismatch between what the shopper expects and what arrives increases.
This is particularly relevant in categories where scale, fit or physical characteristics are difficult to communicate through specifications alone. Baymard, for example, found that 42% of users try to assess product size through imagery, with missing scale context sometimes causing users to misinterpret products entirely.
Visual completeness therefore supports not only the decision to buy, but the quality of the expectation created before purchase.
8. The financial opportunity is in prioritization
For retailers and brands managing thousands of SKUs, creating every possible asset for every product isn't economically rational. The opportunity lies in identifying where visual gaps intersect with commercial importance. A high-traffic SKU missing dimensions or lifestyle imagery should not necessarily receive the same priority as a low-volume SKU missing a secondary angle.
The challenge therefore moves from content production to content intelligence: What is missing? Where? Does it matter for this category? And which products should be fixed first?
That is where visual optimization becomes scalable.
From content volume to Visual Intelligence
For years, ecommerce teams have measured product content primarily through production metrics: assets created, SKUs enriched, content distributed, PDPs published.
But publishing content doesn't guarantee that the right visual experience reaches the shopper. Nfinite estimates that non-compliant product pages can leave 15–25% of potential revenue at risk, while organizations can spend an estimated 40 hours per SKU per year across manual requirements checks, rework and retailer portal submissions.
The next generation of digital shelf optimization therefore requires a different model.
Not: Create → distribute → assume.
But: Analyze → identify → prioritize → create → verify.
This is where Visual Intelligence changes the economics of product content.
Rather than simply producing more assets, brands and retailers can analyze live PDPs, identify missing or inadequate visual coverage, understand which gaps matter for each retailer and product category, and prioritize the content most likely to improve the shopper experience. Because the goal isn't to fill every PDP with more images.
It's to ensure that every image earns its place.
The bottom line
Product visuals aren't a cosmetic layer of the digital shelf. They are part of its revenue infrastructure.
Baymard shows that images are among the first elements shoppers investigate. Amazon recommends multi-image galleries designed to communicate different aspects of a product. And Profitero finds that optimized PDPs can deliver 29% higher ROAS.
The financial risk isn't simply having bad images. It's failing to provide the specific visual information shoppers need to make a confident purchase decision. And because those needs vary by product, category and retailer, image quantity alone is no longer enough.
The real questions are:
What visual content is missing?
Which gaps matter most?
What should we create next?
That's the difference between producing product content — and managing product visuals as a revenue lever.
Insights in your inbox
The hidden cost of visual gaps on the digital shelf
%20(418%20%C3%97%20251%20px)%20(3).png)
Q2 2023
Dynamic Display
With Dynamic Display, shoppers easily mix and match multiple products in real-time — and shop directly from the experience. Retailers can seamlessly embed this on their websites and apps, showcasing these shoppable showrooms wherever they do business online.
Search and tag visuals
Users can now search visuals on the platform! Instead of scrolling through visuals or looking up product or template details, users can easily find visuals using keywords and filters. Filters include visual type, products, organizations, creators, status, and creation date. And now, with the ability to tag visuals, users can also search by tag.
Advanced template search takes this a step further. When users begin creating a visual by selecting a product, in addition to seeing all compatible templates, they can now search for specific templates using a variety of filters, including categories, ratios, tags, and more.
%20(2).png)
Enhanced scene creation
Our redesigned scene editor offers a more immersive editing canvas while providing a simpler, easy-to-learn, and more intuitive UI. Users can swap products, repaint walls — and ultimately create scenes — faster than ever.
Vastly improved swap diversity
We've rebuilt how product swaps work to allow users to browse and swap any product with the accurate geometry. Gone are the limitations of a single or select group of product categories, enabling users to leverage their creativity by quickly transforming a bedroom into a home office or a garage into a home gym.
Preview Visuals Within Email Notifications
Each email notifying you about a new packshot, 360, or lifestyle will include a beautiful preview image helping you maintain context and make more informed decisions.
.png)
Control Your 360° spins
Customize your 360° spins by editing the duration, manipulating the zoom, or changing the camera angle to your exact specifications.
Want to get a full tour of the product? Request a demo today!
Related content
.png)

.png)
.jpg)

Insights in your inbox
Stay up to date


